
Best Horse Racing Betting Sites – Bet on Horse Racing in 2026
Loading...
Introduction
Horse racing odds are the language through which bookmakers communicate. Every price tells a story about probability, market sentiment, and the balance of money wagered on each runner. Understanding this language transforms betting from guesswork into informed decision-making, yet many punters place wagers without truly grasping what the numbers represent.
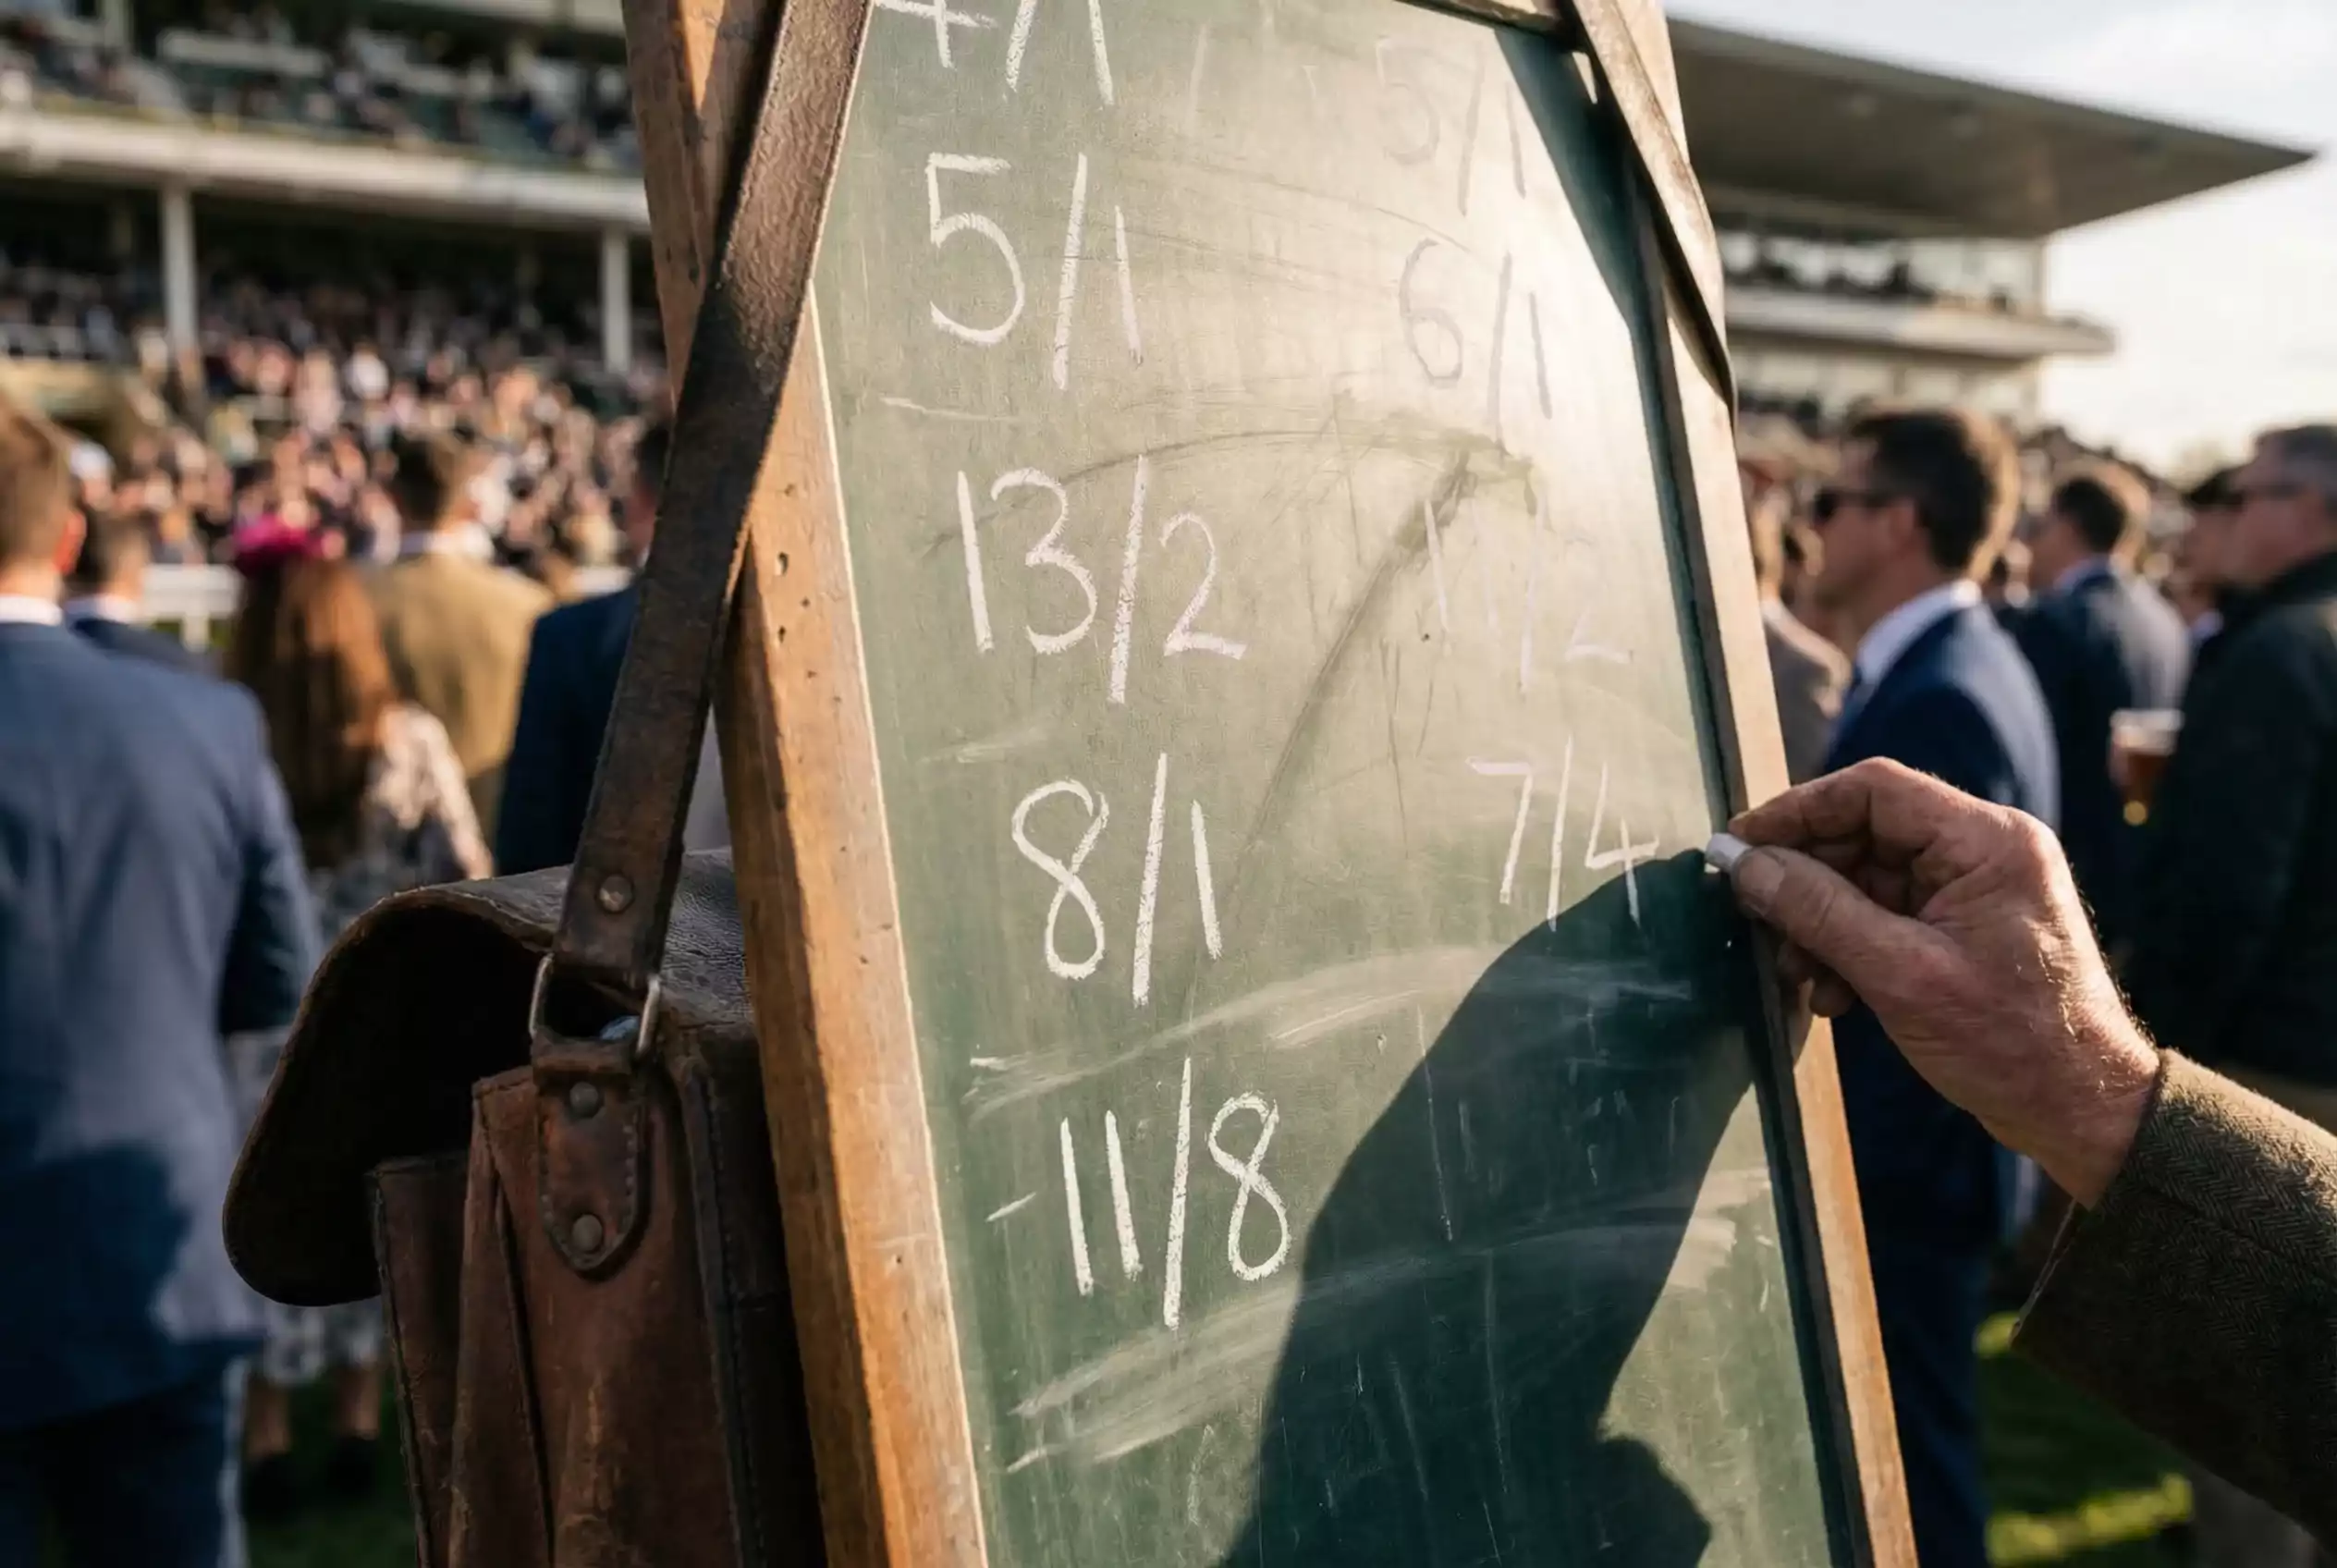
British racing remains wedded to fractional odds — the 5/1, 11/4, and 6/4 expressions that appear in newspapers, on racecourse boards, and across betting shop displays. These fractions date back centuries, and despite the rise of decimal odds on betting exchanges, fractional pricing persists as the dominant format for traditional bookmaking. This loyalty isn’t mere conservatism; fractional odds communicate profit-to-stake relationships in a way that many British punters find intuitive once they’ve learned the system.
The scale of betting on British racing makes understanding odds more than an academic exercise. Entain’s analysis reveals that the Grand National attracts 700% more bets than the Cheltenham Gold Cup, despite both races featuring elite jumps horses. That disparity reflects the National’s unique cultural position, but navigating odds confidently enables punters to approach any race with clarity about what their stake can return and what probability the market assigns to each outcome.
This guide examines horse racing odds from foundation to application. We’ll decode fractional odds before exploring their decimal equivalents, then demonstrate conversion between formats. The concept of implied probability reveals how odds translate to chances of winning, while practical sections address how to read a racecard, compare prices across bookmakers, and interpret market movements that signal shifts in expectation.
Fractional Odds In Depth
Fractional odds express the profit you’ll receive relative to your stake. At 5/1 (spoken as “five to one”), you win five pounds for every pound staked. The numerator represents profit; the denominator represents stake. Return your original stake on top, and a successful ten-pound bet at 5/1 yields sixty pounds — fifty pounds profit plus the ten-pound stake returned.
Reading Common Fractional Odds
Certain fractions appear constantly across British racing, and recognising them instantly is essential for following markets in real time.
Evens (1/1) represents the simplest fraction: profit equals stake. A twenty-pound winning bet at evens returns forty pounds. Evens odds imply the bookmaker considers the horse roughly a fifty-fifty proposition — though this simplification ignores the margin built into all prices.
Odds-on prices (where the denominator exceeds the numerator) indicate favourites. At 4/6, you stake six pounds to win four. Odds-on shots must win frequently to generate long-term profit because the return per successful bet is less than the stake risked. At 1/3, you need three winners from every four bets just to break even.
Odds-against prices (numerator exceeds denominator) represent the majority of betting opportunities. Common British fractions include 11/8, 6/4, 15/8, 9/4, 5/2, 11/4, 7/2, 4/1, 9/2, and 5/1 through to triple-figure outsiders. Each fraction has a decimal equivalent, but traditional betting culture still announces prices in these terms.
Understanding Odds Against Versus Odds On
The distinction matters for bet sizing and expectation. Odds-against bets pay more than you risk, creating potential for single wagers to generate meaningful returns. Odds-on bets require repeated success because each win returns less than each loss costs.
Consider two punters with identical strike rates of 40%. Punter A backs horses averaging 3/1. Over one hundred bets at ten pounds each, forty winners return forty lots of forty pounds (stake plus thirty pounds profit), totalling £1,600. Sixty losers cost £600. Net profit: £1,000.
Punter B backs odds-on shots averaging 4/5. Forty winners return forty lots of eighteen pounds (stake plus eight pounds profit), totalling £720. Sixty losers cost £600. Net profit: £120.
Same strike rate, vastly different outcomes. Odds-against betting tolerates lower strike rates because each winner compensates for multiple losers. Odds-on betting demands accuracy that most punters cannot sustain.
Fractional Odds Quirks
Certain fractions exist purely by convention rather than mathematical necessity. Why 11/8 rather than 3/2? Why 100/30 rather than 10/3? Tradition and the oral culture of betting rings established these prices, and they persist because everyone understands them. Betting exchanges sometimes display cleaner decimal equivalents (2.375 for 11/8, 4.33 for 100/30), but course bookmakers and traditional firms maintain fractional vocabulary.
Non-standard fractions occasionally appear when bookmakers want precise pricing. A horse might trade at 13/8 on an exchange (2.625 decimal), though a course layer would likely round to either 6/4 or 7/4. Online bookmakers can price to any fraction, creating occasional oddities like 17/10 or 23/20 that break from traditional increments.
Decimal Odds In Depth
Decimal odds express total return rather than profit. At 6.0, a successful one-pound bet returns six pounds total — five pounds profit plus the original stake. This format dominates betting exchanges like Betfair because it simplifies return calculations, particularly for complex matched bets and trading positions.
The key distinction from fractional odds: decimal prices already include your stake in the quoted figure. A horse at 5/1 fractional equals 6.0 decimal. The fractional form tells you profit (five units); the decimal form tells you total return (six units including stake).
Calculating Returns
Decimal odds make return calculations trivial. Multiply your stake by the decimal odds to find your total return. Ten pounds at 3.5 returns thirty-five pounds. No mental arithmetic required to add back the stake — it’s already included.
This simplicity becomes particularly valuable when comparing odds across bookmakers or calculating accumulator returns. A three-horse accumulator at 2.5, 3.0, and 4.0 decimal returns: £10 × 2.5 × 3.0 × 4.0 = £300. In fractional terms (3/2, 2/1, 3/1), you’d calculate profits at each stage and compound them — achievable, but more mentally taxing.
Decimal Odds on Exchanges
Betting exchanges price exclusively in decimal format, typically to two decimal places. This precision allows odds like 2.02, 5.50, or 11.00 that have no neat fractional equivalent. Exchange users learn to think in decimals because the platforms require it.
Exchange odds also tend to exceed traditional bookmaker prices because they don’t include the same built-in margin. A horse at 4/1 with a bookmaker might trade at 5.5 (9/2 equivalent) on an exchange. The difference reflects the commission model — exchanges charge a percentage of winning bets rather than building margin into every price.
Why Decimals Haven’t Replaced Fractions
Despite their mathematical elegance, decimal odds haven’t displaced fractions in British racing culture. Several factors explain this persistence.
First, tradition. Racing commentary, newspaper coverage, and course bookmakers still operate in fractional language. A commentator calling a horse “6.0” rather than “5/1” would sound alien to most British ears.
Second, fractional odds convey profit relationships more intuitively for many people. “Three to one against” immediately communicates that you win three units for every one risked. “4.0” requires subtraction to extract the profit component.
Third, the demographic skew of racing audiences. While younger bettors often encounter decimals first through online betting, traditional racing audiences came of age with fractional pricing and see no reason to change.
Fluency in both formats represents the ideal. You can follow racecourse markets in fractions while placing bets on exchanges in decimals, converting mentally as situations demand.
Converting Between Formats
Moving between fractional and decimal odds requires one simple formula in each direction. Master these conversions and you can operate comfortably in any betting environment.
Fractional to Decimal
Divide the numerator by the denominator, then add one.
For 5/1: (5 ÷ 1) + 1 = 6.0
For 11/4: (11 ÷ 4) + 1 = 2.75 + 1 = 3.75
For 1/3: (1 ÷ 3) + 1 = 0.33 + 1 = 1.33
For 6/4: (6 ÷ 4) + 1 = 1.5 + 1 = 2.5
Decimal to Fractional
Subtract one from the decimal, then express the result as a fraction in its simplest form.
For 4.0: 4.0 – 1 = 3/1
For 2.5: 2.5 – 1 = 1.5 = 3/2 (or 6/4 in traditional terms)
For 1.8: 1.8 – 1 = 0.8 = 4/5
For 7.5: 7.5 – 1 = 6.5 = 13/2
Some decimal odds convert to awkward fractions. A price of 2.38 becomes 1.38, which as a fraction is 69/50 — not a price any traditional bookmaker would quote. In these cases, exchanges simply display the decimal value without requiring a fractional equivalent.
Quick Reference Table
| Fractional | Decimal | Implied Probability |
|---|---|---|
| 1/5 | 1.20 | 83.3% |
| 1/3 | 1.33 | 75.0% |
| 1/2 | 1.50 | 66.7% |
| 4/6 | 1.67 | 60.0% |
| 4/5 | 1.80 | 55.6% |
| Evens | 2.00 | 50.0% |
| 6/5 | 2.20 | 45.5% |
| 6/4 | 2.50 | 40.0% |
| 7/4 | 2.75 | 36.4% |
| 2/1 | 3.00 | 33.3% |
| 5/2 | 3.50 | 28.6% |
| 3/1 | 4.00 | 25.0% |
| 4/1 | 5.00 | 20.0% |
| 5/1 | 6.00 | 16.7% |
| 10/1 | 11.00 | 9.1% |
| 20/1 | 21.00 | 4.8% |
Implied Probability
Every set of odds implies a probability. The market is saying: based on the money wagered and our assessment, this horse has a certain chance of winning. Understanding implied probability allows punters to compare their own assessments against the market’s view and identify potential value.
Calculating Implied Probability
For fractional odds, the formula is: denominator ÷ (numerator + denominator) × 100
At 4/1: 1 ÷ (4 + 1) × 100 = 20%. The market implies this horse wins once in every five attempts.
At 2/1: 1 ÷ (2 + 1) × 100 = 33.3%. Roughly one win in three.
At evens: 1 ÷ (1 + 1) × 100 = 50%. A coin flip, conceptually.
For decimal odds, simply invert the price: (1 ÷ decimal odds) × 100
At 4.0 decimal: (1 ÷ 4.0) × 100 = 25%
At 2.5 decimal: (1 ÷ 2.5) × 100 = 40%
At 1.5 decimal: (1 ÷ 1.5) × 100 = 66.7%
The Overround Explained
If you calculate implied probabilities for every horse in a race and sum them, the total exceeds 100%. This excess is the overround — the bookmaker’s built-in margin that ensures profit regardless of outcome.
In a six-runner race with odds of evens, 3/1, 5/1, 8/1, 12/1, and 20/1, the implied probabilities are 50%, 25%, 16.7%, 11.1%, 7.7%, and 4.8%. Summed: approximately 115%. That 15% overround represents the bookmaker’s theoretical edge.
Overrounds vary by market competitiveness. Major festivals with heavy betting activity often see overrounds below 110% as bookmakers compete on price. Obscure midweek meetings might carry overrounds of 120% or more. Lower overrounds favour punters because prices more closely reflect true probabilities.
Finding Value Through Probability Assessment
Value exists when your estimated probability of a horse winning exceeds the probability implied by the odds. If you believe a horse has a 30% chance of winning but the market prices it at 5/1 (16.7% implied), you’ve identified potential value.
The challenge lies in accurately assessing true probabilities — a task at which humans routinely fail. Form, conditions, jockey bookings, and dozens of other factors influence outcomes. Professional punters invest considerable effort in building probability models that systematically identify when market prices understate a horse’s chances.
For recreational punters, a simpler approach suffices. Ask yourself: does this horse have a better chance than the odds suggest? If you’re backing 10/1 shots that should really be 6/1, long-term profits follow. If you’re backing 10/1 shots that are genuinely 15/1 propositions, losses accumulate. Honest self-assessment about selection quality separates profitable punters from hopeful ones.
Comparing Odds Across Bookmakers
Prices vary between bookmakers, sometimes substantially. The same horse might be 7/1 with one firm and 6/1 with another. Over hundreds of bets, consistently taking the best available price generates significantly higher returns than accepting whatever odds your default account displays.
Why Prices Differ
Bookmakers form their own views on race outcomes, influenced by their customer betting patterns, risk exposure, and commercial strategies. A bookmaker who has taken heavy liability on the favourite might extend prices on other runners to balance their book. A firm running a promotion on a particular horse might price that selection generously while compressing odds elsewhere.
Customer profile also matters. Bookmakers who attract sharp, professional punters often price more conservatively than those catering primarily to recreational bettors. The latter can afford slightly looser prices because their customers bet less efficiently overall.
Odds Comparison Sites
Dedicated comparison services aggregate prices from dozens of bookmakers into single displays, showing best available odds for every runner. These tools have transformed betting by making price shopping trivially easy. Where previous generations of punters might have held accounts with two or three bookmakers, active bettors now maintain many accounts to access the best price for any given selection.
Using comparison tools effectively requires checking them close to race time, because odds change constantly as money flows. The best morning price might not remain the best price by afternoon.
Best Odds Guaranteed
Many bookmakers offer Best Odds Guaranteed (BOG) on UK and Irish horse racing. Under BOG terms, if you take an early price and the Starting Price (SP) is higher, you receive the SP instead. This effectively eliminates the risk of taking a price that gets “steamed” lower before the race.
BOG coverage varies by bookmaker. Some offer it only on morning prices before a certain time, typically 9am or 10am. Others extend BOG to all bets placed on the day of the race. A few restrict BOG to specific meeting types or exclude ante-post markets entirely. Checking the specific terms before assuming protection applies prevents disappointment at settlement.
The OLBG/YouGov survey found that 51% of Grand National bettors choose their horse based on its name rather than form analysis. For these casual punters, BOG provides protection they might not even realise they’re receiving — if the horse they selected because they liked its name drifts from 20/1 to 25/1, BOG ensures they benefit from the movement rather than missing out.
Reading Odds in Practice
Race cards, betting boards, and digital displays all present odds information differently. Learning to extract meaning from each format enables confident navigation of betting environments from the ring to the app.
The Race Card
Physical and digital race cards typically show forecast odds compiled by specialist odds compilers. These represent predicted morning prices based on form analysis, stable intelligence, and historical patterns. The newspaper price or Racing Post forecast is a starting point for comparison, not a guaranteed betting price.
Cards also display crucial information that influences odds: weights, draw positions, jockey bookings, recent form figures, trainer statistics, and going preferences. Experienced punters read this data to form their own probability assessments before checking what odds the market offers.
Early Prices and Market Formation
Bookmakers open betting markets on major races days or weeks in advance. These early prices, sometimes called ante-post prices, carry different rules — typically no refunds for non-runners unless specifically stated. Early markets provide opportunities for punters who identify value before the masses pile in, though they also carry risks if circumstances change.
On race day, bookmakers issue morning prices, typically around 9am for the day’s feature meetings. These prices represent the opening market for standard betting (with non-runner refunds) and tend to attract the first wave of serious money. Prices shift throughout the morning and afternoon as bets accumulate and information emerges.
Starting Price
The Starting Price (SP) is the official price recorded at the moment the race begins. In British racing, the Starting Price Regulatory Commission (SPRC) determines SP using a standardised methodology. Prices from a sample of six to twenty-four on-course and online bookmakers are sorted from longest to shortest. The list is divided in half, and the shortest price in the “long” half becomes the SP — essentially a median of market prices at the off.
SP matters for punters who don’t take a fixed price. “Take SP” betting means your bet settles at whatever the official starting price turns out to be. This approach suits punters without time to monitor price movements or those who prefer not to lock in an early price that might shorten before the off.
Betfair SP Versus Industry SP
Betting exchanges calculate their own starting prices using matched bets rather than bookmaker quotes. The Betfair SP often differs from the traditional industry SP, sometimes significantly.
For heavily backed favourites, the exchange SP sometimes runs shorter than the industry figure because liquidity concentrates on the market leaders. For outsiders, exchange SP can exceed industry SP because exchange bettors face less constraint on offering longer prices. Understanding these tendencies helps when deciding whether to take an early price, go SP with a bookmaker, or opt for Betfair SP.
Understanding Odds Movement
Odds change constantly between market opening and the off. These movements contain information — sometimes actionable, sometimes misleading. Interpreting them correctly separates informed punters from those chasing signals they don’t understand.
Steamers and Drifters
A “steamer” is a horse whose odds shorten significantly, indicating heavy support. A horse opening at 10/1 that contracts to 6/1 by the off has steamed — money has piled on, whether from public enthusiasm, professional punters, or stable connections backing their own horse.
A “drifter” moves the opposite direction. A 5/1 morning price that becomes 8/1 by post time signals lack of support, possibly concerning news about the horse’s wellbeing, connections losing confidence, or simply the market correcting an initial overestimate of the horse’s chances.
Neither direction guarantees anything about race outcome. Steamers win often enough that the betting public keeps following them, but confirmation bias means people remember the gambles that landed while forgetting those that didn’t. Drifters sometimes win at better prices than smart money anticipated. Movement is a data point, not a directive.
Causes of Price Movement
Money drives odds changes most directly. Large bets from respected accounts cause bookmakers to cut odds immediately. Accumulation of smaller bets has the same effect over time. When bookmakers see their liability growing on one horse, they reduce that horse’s price to discourage further betting and extend prices elsewhere to attract balancing money.
Information moves markets too. A trainer quote suggesting their horse is primed for a big run might trigger punter response. News of jockey changes, ground shifts, or veterinary concerns spreads through racing networks and finds expression in betting patterns.
“Festivals such as Cheltenham and big Saturday cards remain popular with racing punters,” Richard Wayman, the BHA’s Director of Racing, observed in the British Racing Report 2025. These high-profile meetings generate intense betting activity, making their markets particularly liquid and responsive to information.
Reading Market Signals
Professional punters monitor market movements for patterns that might indicate where value lies. Late money from well-informed sources often shortens odds in the final minutes before a race. Tracking which stables consistently support their runners, and whether those gambles tend to succeed, provides edge over time.
Casual punters should avoid chasing every market move. The temptation to back a horse purely because it’s shortened can lead to poor selections at unfavourable prices. Better to form your own view beforehand and note whether the market confirms or contradicts your assessment. If you liked a horse at 8/1 and it’s now 5/1, you might have identified value — or you might have identified the same thing as everyone else.
Non-Runner Impact
When a horse is withdrawn, prices on remaining runners shorten to reflect reduced competition. A single non-runner from a twelve-horse field causes modest adjustment; the withdrawal of the favourite transforms the entire market. Rule 4 deductions protect against punters exploiting these situations by reducing payouts when odds contract post-bet.
Tracking non-runners explains some otherwise puzzling price movements. If a horse suddenly shortens despite no apparent news, checking for withdrawn rivals often reveals the cause. The market reprices instantly when information emerges, and staying current with the declared runners list prevents confusion.